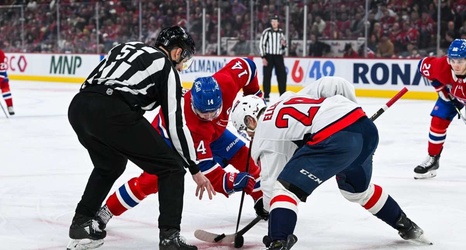
Heading into Game 3, we talked about line matching both generally and specifically. So how’d it play out in two games in Montreal? Here are the five-on-five matchups for the two games (Game 3 on the left, Game 4 on the right):
Just from a quick glance, the chart on the right has a lot more red (good for the Caps), which makes sense – per Natural Stat Trick, the Caps had a five-on-five expected goals percentage of just 33.
