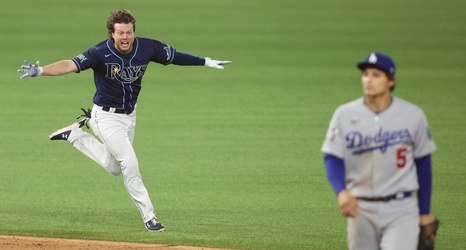
The win-expectancy graph tells the story as well as anything—a series of jagged back-and-forths, dipping and lurching over the course of a tense few hours, before a spectacular rise at the last second to a final place of clarity. It looks bonkers. The typical metaphor for these graphs is a roller coaster, but if this one had been a roller coaster, it would have killed you. It suggests, accurately, the scale of the bottom of the ninth of Game 4 of the 2020 World Series.
The graph accurately communicates the scale. But it does not convey the experience.
