
Today I wanted to provide some valuable team metrics for the 2022 regular season. For the second season, I’ve used a cumulative format of key numbers across the NFL, along with takeaways for the Steelers season. The three main stats used are Adjusted Net Yards per Pass Attempt (ANY/A), Turnovers and Explosive Plays (TOX), Successful Run Rates. The total calculations are called CATS for short.
First, let’s look at ANY/A: (Passing Yards – Sack Yards + (20* Passing TD) – 45 * Interceptions)) / (Passes Attempted + Times Sacked). Using the differential for offenses (OANY/A) and defenses (DANY/A), this is the most predictive individual stat in predicting Super Bowl Winners that I have found in my studies:
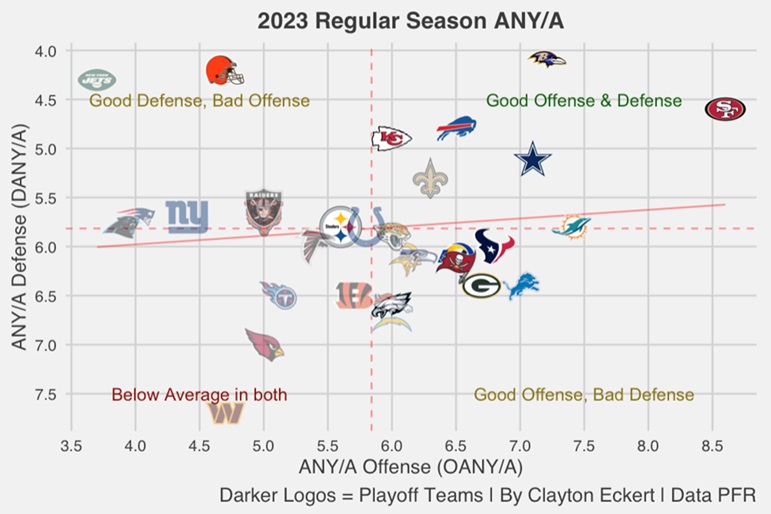
Looking at the teams on the top right, we see five of the six teams comfortably made the playoffs (83.