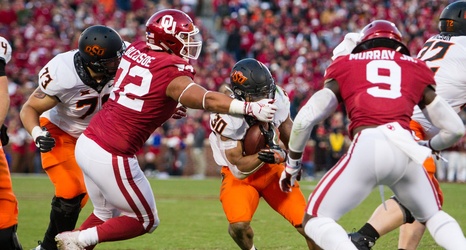
There was a great question in The Chamber today about how Mike Gundy’s 2-12 record against his cross-state rival compares to other teams against OU in that same period of time. So I pulled every team OU has played since 2005 and made a chart. Here it is.
| Brigham Young | 1 | 0 | 100% |
| Alabama | 1 | 1 | 50% |
| Houston | 1 | 1 | 50% |
| Oregon | 1 | 1 | 50% |
| Texas | 7 | 9 | 44% |
| Colorado | 1 | 2 | 33% |
| Baylor | 3 | 12 | 20% |
| Nebraska | 1 | 4 | 20% |
| Missouri | 1 | 5 | 17% |
| Oklahoma State | 2 | 12 | 14% |
| West Virginia | 1 | 8 | 11% |
| Kansas | 0 | 12 | 0% |
| Cincinnati | 0 | 2 | 0% |
| Louisiana-Monroe | 0 | 2 | 0% |
| Tennessee | 0 | 2 | 0% |
| Washington | 0 | 2 | 0% |
| Auburn | 0 | 1 | 0% |
| Connecticut | 0 | 1 | 0% |
| Florida Atlantic | 0 | 1 | 0% |
| Louisiana Tech | 0 | 1 | 0% |
| Stanford | 0 | 1 | 0% |
• Clemson.