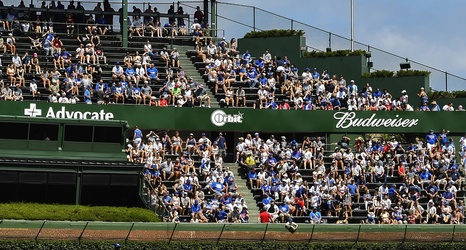
As you might imagine, crowds at Wrigley Field thinned out after the early August visits of the Brewers and White Sox. Some of the in-house crowds were the smallest seen during the summer months since at least 2012.
Beginning with the Royals series that started August 20, I made an estimate of how many people were actually in the house at Wrigley. Here are those estimates, along with the actual announced crowds, for the 16 Cubs home games since August 20:
Cubs attendance and in-house estimates 8/20/21 to 9/12/21
| 8/20 | Royals | 31,835 | 22,000 |
| 8/21 | Royals | 34,005 | 27,000 |
| 8/22 | Royals | 29,610 | 25,000 |
| 8/23 | Rockies | 25,577 | 16,000 |
| 8/25 (1) | Rockies | 24,936 | 10,000 |
| 8/25 (2) | Rockies | 24,161 | 12,000 |
| 9/2 | Pirates | 26,963 | 15,000 |
| 9/3 | Pirates | 24,441 | 12,000 |
| 9/4 | Pirates | 30,020 | 22,000 |
| 9/5 | Pirates | 30,155 | 26,000 |
| 9/6 | Reds | 27,289 | 20,000 |
| 9/7 | Reds | 24,975 | 10,000 |
| 9/8 | Reds | 25,861 | 12,000 |
| 9/10 | Giants | 29,439 | 22,000 |
| 9/11 | Giants | 34,723 | 29,000 |
| 9/12 | Giants | 32,021 | 26,000 |
| TOTAL | 456,011 | 306,000 | |
| AVERAGE | 28,501 | 19,125 |
Weather was a factor for a couple of the low turnouts, and another estimate of only 10,000 in the house was made for the first game of the August 25 doubleheader, a game rescheduled from a night game rainout the day before to an afternoon contest.
