For data definitions and disclaimers, take a look at my rundown in the first article in this series: Graphing the SEC, 2023 Week 1
SEC Week 6 Success Rates
| Rank | Game | Result | SR | -- | Opp SR | --- |
|---|---|---|---|---|---|---|
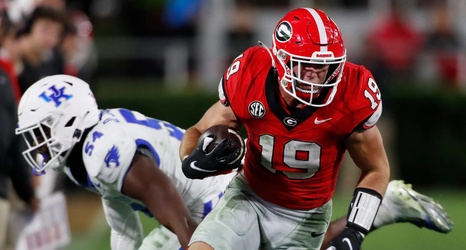
| 1 | Georgia vs. Kentucky | W 51-13 | 66% | |||||||||||||| | 34% | |||||| |
| 2 | Florida vs. Vanderbilt | W 38-14 | 55% | |||||||||| | 31% | |||||| |
| 3 | LSU @ Missouri | W 49-39 | 50% | |||||||||| | 47% | |||||||||| |
| 4 | Oklahoma @ Texas | W 34-30 | 49% | |||||||||| | 47% | |||||||||| |
| 5 | Texas vs. |